
Configure Autoscaling for AWS Lambda Provisioned Concurrency with AWS CDK
A quick intro to Provisioned Concurrency Scaling and strategies


A couple of weeks ago I was working on some AWS CDK based code and I was trying to figure out how to configure auto-scaling for the provisioned concurrency configuration of an AWS Lambda function. We wanted to run some performance tests on our service and were wondering how scaling provisioned concurrency would impact our overall latency. We tried with the default configuration but also wanted to experiment with a bit more aggressive scaling policy so we had to provide our own metric configuration. In this post, I will explain what provisioned concurrency is and how to set up an auto-scaling configuration for it using AWS CDK. We’ll be looking at using predefined metric configurations, but also how to do it with a custom metric.
What is provisioned concurrency and how does it relate to latency and cost?
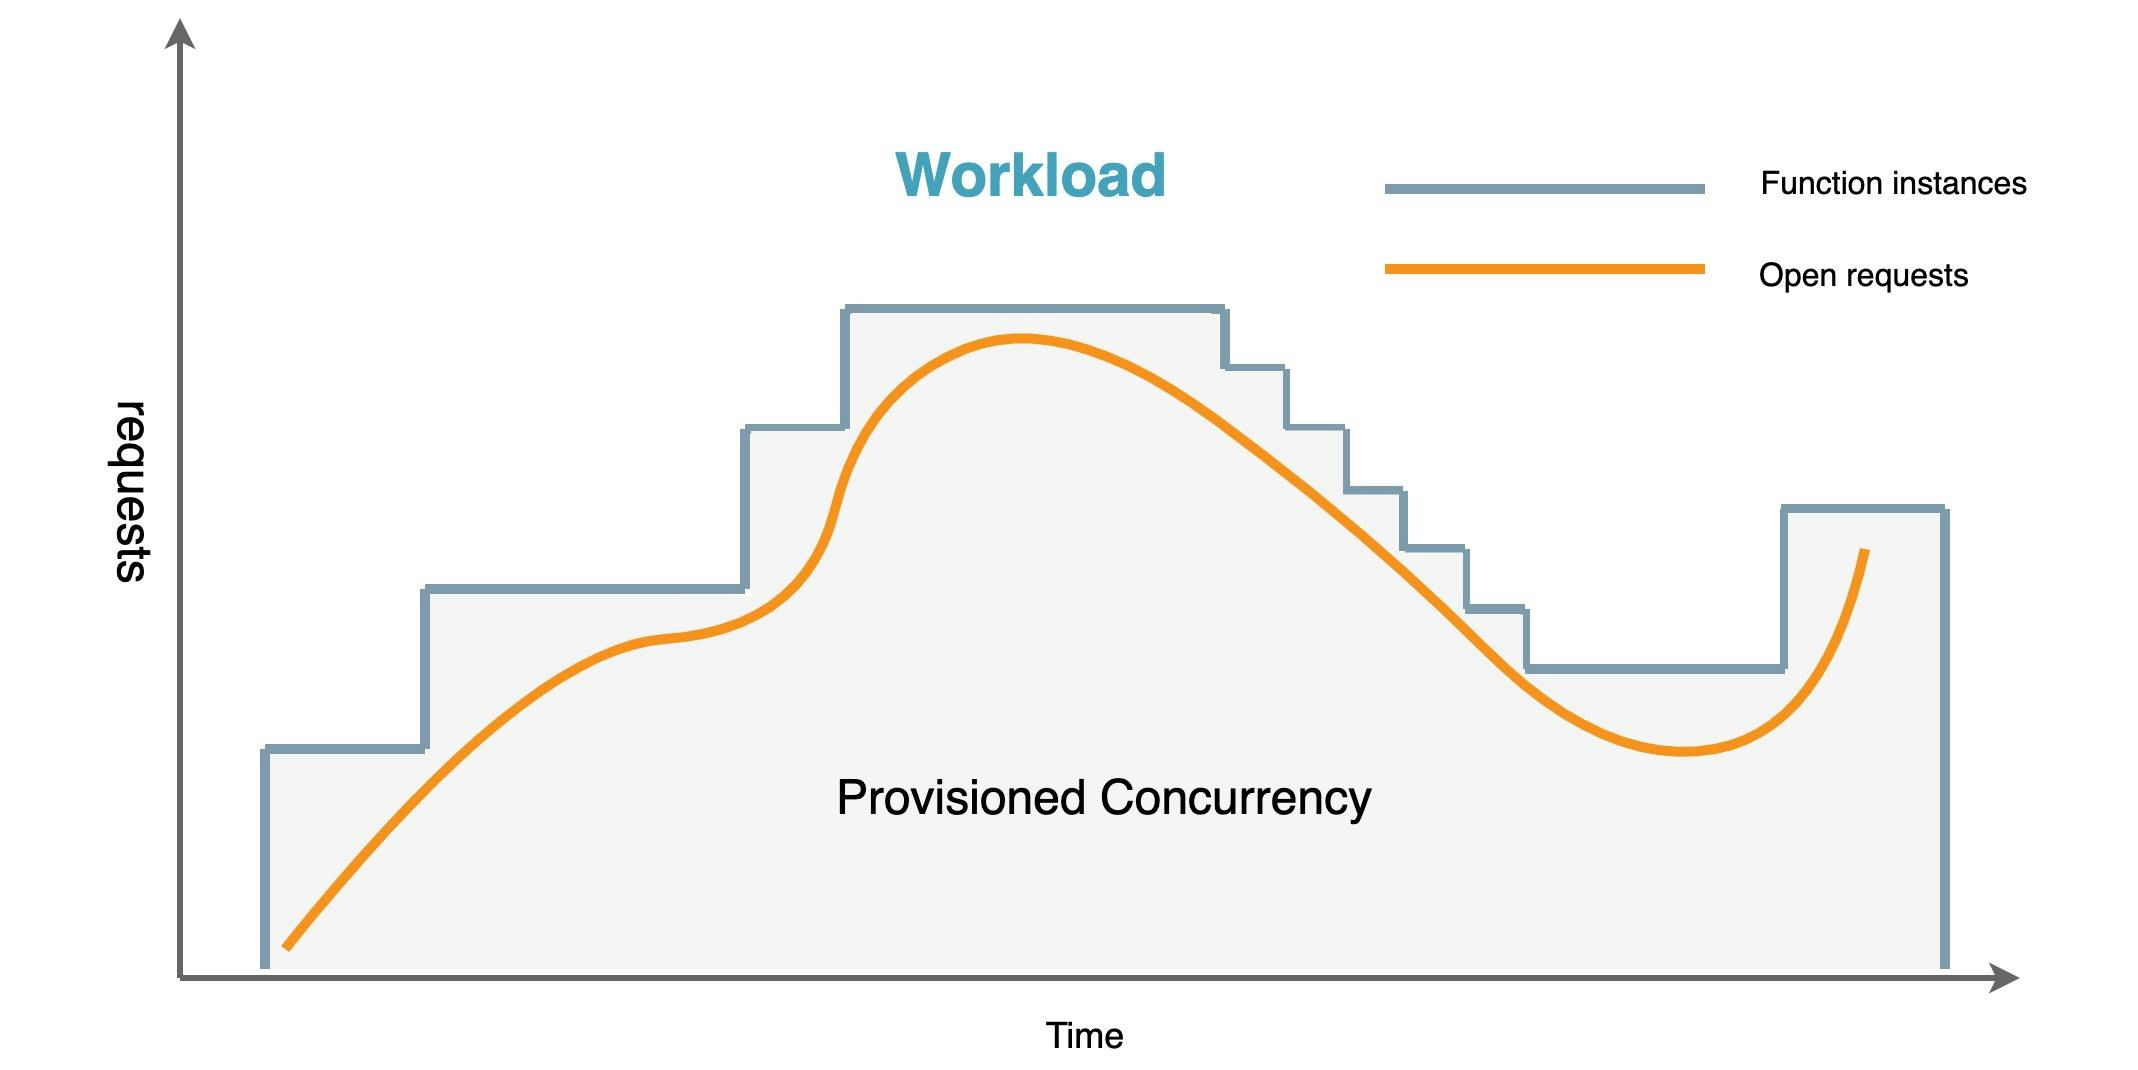
Provisioned concurrency is a feature for AWS Lambda that got introduced in 2019. It helps you keep one or more AWS lambda function instances in a 'warm' state in case of sudden bursts of traffic. This is particularly useful if you have functions that take a bit of time to initialize while traffic is increasing and you want to keep the latency as low as possible. Without provisioned concurrency (and without autoscaling) you might end up having a cold starts when traffic increases, which will result in a high latency for your end consumer. This can happen with all languages, but in particular with Java or .Net based applications. As you're paying for these 'warm' execution environments you don't want to have too many of them running when they're not in use. To prevent this there are two ways of adjusting your concurrency setting:
- Scheduled (very useful if you have very predictable load patterns)
- Target tracking (scale based on the increase or decrease of load)
When you want to calculate the required concurrency you can use the following formula Transactions per second * Function Duration (in seconds). The shorter your function runs, the less concurrency you will need. Sometimes you have unpredictable traffic patterns, so a target tracking auto-scaling strategy is the best option. With the target tracking policy attached to application auto-scaling it will make sure that the number of concurrently available lambdas will stay in line with the number of requests.
Now let's see what this looks like from an AWS CDK perspective.
Configuring our Infrastructure as Code with AWS CDK
Now in CDK, we will need to define and configure our Lambda function. To do so you can use the Function construct and reference the jar that contains your actual code.
Function javaBasedFunction =
new Function(this, "java-based-function-id", FunctionProps.builder()
        .runtime(Runtime.JAVA_11)
        .code(Code.fromAsset("../app/target/java-app.jar"))
        .handler("com.jeroenreijn.aws.samples.scaling.FunctionHandler")
        .memorySize(1024)
        .timeout(Duration.seconds(10))
        .logRetention(RetentionDays.ONE_WEEK)
        .build());
Provisioned concurrency for a lambda function can only be configured if the lambda function has an alias or version. In this example, we will create an alias for our function and map that alias to the latest version of our function. When deploying the CDK stack a new version will be created and the alias will be referenced to the latest version. For our function, we will start with a single provisioned lambda function.
Alias alias = Alias.Builder.create(this, "auto-scaling-lambda-alias-id")
                .aliasName("auto-scaling-lambda-alias")
                .provisionedConcurrentExecutions(1)
                .version(function.getCurrentVersion())
                .build();
So far so good for defining our function and function alias.
Registering Lambda functions as scalable targets with Application Auto Scaling
Now that we have everything in place for our Lambda function we will need to register our function as a scalable target.
Through the AWS CDK, there are two ways of configuring autoscaling for the provisioned concurrency configuration of our function.
- Configuring scaling options directly on the alias
- Configuring scaling options via application autoscaling
So let's explore both options.
Configuring scaling options directly on the alias
The Function Alias has a short-hand method for configuring provisioned concurrency scaling. You can do this by calling the .addAutoScaling method on the Alias.
AutoScalingOptions autoScalingOptions =
    AutoScalingOptions.builder()
            .minCapacity(0)
            .maxCapacity(10)
            .build();

IScalableFunctionAttribute iScalableFunctionAttribute =
        alias.addAutoScaling(autoScalingOptions);

iScalableFunctionAttribute.scaleOnUtilization(
        UtilizationScalingOptions
              .builder()
              .utilizationTarget(0.7)
              .build()
);
Adding a scaling strategy on the alias is pretty straight forward. You can use both scaling on utilization and scale by schedule. However, it does not seem to allow for scaling by a custom metric configuration.
Configuring scaling options via application autoscaling
In CDK we can leverage the constructs available for the application autoscaling service. In our case, we will be primarily using the ScalableTarget construct to define the target that we want to scale. It requires a couple of configuration options like; min and max capacity, the id of the resource we want to scale, and the dimension we want to scale. In Java this looks like this:
ScalableTarget scalableTarget =
    ScalableTarget.Builder.create(this, "auto-scaling-lambda-target-id")
                .serviceNamespace(ServiceNamespace.LAMBDA)
                .minCapacity(1)
                .maxCapacity(10)
                .resourceId(String.format("function:%s:%s", function.getFunctionName(), alias.getAliasName()))
                .scalableDimension("lambda:function:ProvisionedConcurrency")
                .build();
Now that we've defined the target we still need to provide the scaling strategy. In our case, we want to scale on the utilization of our provisioned concurrency setting. CDK, by default, has a predefined setting to scale on the ProvisionedConcurrencyUtilization metric. Besides the metric, we also need to specify a target value for which application autoscaling will trigger.
scalableTarget
        .scaleToTrackMetric("PCU", BasicTargetTrackingScalingPolicyProps.builder()
        .predefinedMetric(
             PredefinedMetric.LAMBDA_PROVISIONED_CONCURRENCY_UTILIZATION
        )
        .targetValue(0.7)
        .build()
);
The generated scaling policy will result in two Cloudwatch alarms:
- An alarm for scaling up that requires 3 data points over 1 minute each
- An alarm for scaling down that requires 15 data points over 15 minutes
Both of these alarms will use the ProvisionedConcurrencyUtilization metric in combination with the Average statistic by default, which means that on average over these 3 data points (minutes) the value needs to be above 0.7 to trigger a scale-up.
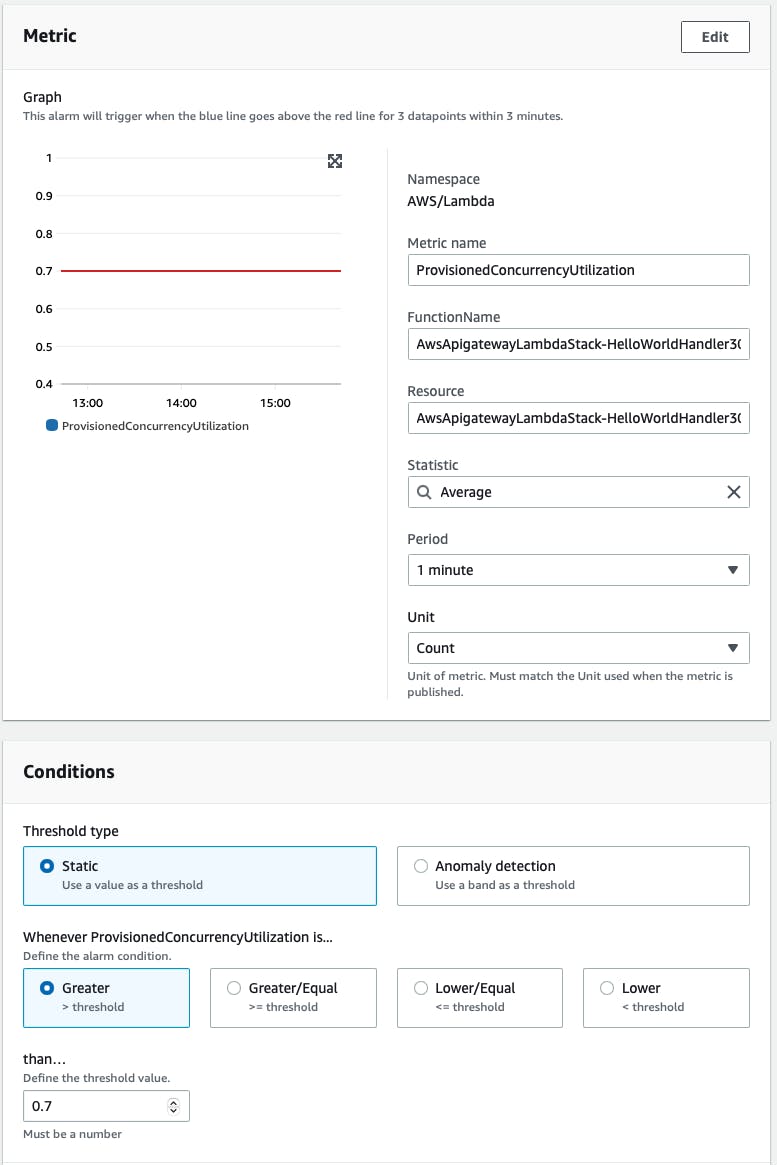
Sometimes you might have sudden spikes which only happen in the first minute and not in the second or third, which will result in no scaling action. Depending on your use case this could be a problem. An alternative could be to make this a bit more of an aggressive scaling policy and use the Maximum statistic, which causes the alarm to trigger if the maximum utilization was above 0.7 for only one out of three data points. To do that we need to define the metric ourselves and specify the Maximum statistic.
Metric maximumMetric = Metric.Builder.create()
        .namespace("AWS/Lambda")
        .metricName("ProvisionedConcurrencyUtilization")
        .statistic("Maximum")
        .dimensionsMap(
                Map.of(
                        "FunctionName", function.getFunctionName(),
                        "Resource", function.getFunctionName() + ":" + alias.getAliasName()))
        .unit(Unit.COUNT)
        .period(Duration.minutes(1))
        .build();
Take a good look at the .dimensionsMap method as I got this wrong the first time and my scale up and down did not happen. It's important to get these values right. To be able to use the custom metric we can specify it on our TargetTracking scaling policy.
scalableTarget
    .scaleToTrackMetric("PCU", BasicTargetTrackingScalingPolicyProps.builder()
        .customMetric(maximumMetric)
        .targetValue(0.7)
        .build()
    );
Testing the application autoscaling configuration
It's important to validate that we've set up everything in the right way. I can tell you from experience when it comes to writing CDK code you sometimes miss predefined static values for specific services that contain the correct format and pattern for instance like with the .dimensionsMap as you can see above. If you're using the AWS console, the UI will take care of these dimensions for you, but when you manually have to specify them you need to make sure to validate that they contain the correct values for application autoscaling to do its job.
We can test autoscaling on our custom metric with a simple load testing tool like Artillery or Apache Benchmark. In this example, I'm using Apache Benchmark as it's quite simple to run from the command line and I already had it installed on my machine.
$ ab -n 20000 -c 20 https://someid.execute-api.eu-west-1.amazonaws.com/test/
If everything is set up correctly the scaling policy should trigger application autoscaling to scale up the number of provisioned concurrent lambda functions.
Validating application autoscaling
You should be able to see the value change in the AWS console under the Provisioned concurrency configuration, but I always prefer to use the AWS command-line interface to see if it's doing its job. To see the scaling activities for the AWS Lambda functions you can call the application autoscaling service and ask for scaling activities that happen within the Lambda namespace.
$ aws application-autoscaling describe-scaling-activities --service-namespace=lambda
Now if you did that correctly it should result in a response that describes all the scaling activities going on for your AWS Lambda functions. You can see specify --resource-ids=someid if you only want to see the activities for a specific function.
{
    "ScalingActivities": [
        {
            "ActivityId": "52873ef2-2a0d-4af4-8f58-62467cd7b4ee",
            "ServiceNamespace": "lambda",
            "ResourceId": "function:AwsApigatewayLambdaStack-HelloWorldHandler30C22324-E6HowYd9st0b:hello-world-lambda-alias",
            "ScalableDimension": "lambda:function:ProvisionedConcurrency",
            "Description": "Setting desired concurrency to 5.",
            "Cause": "monitor alarm TargetTracking-function:AwsApigatewayLambdaStack-HelloWorldHandler30C22324-E6HowYd9st0b:hello-world-lambda-alias-AlarmHigh-34b6d7bb-2ab4-4a9b-9d80-7110edcfe768 in state ALARM
triggered policy AwsApigatewayLambdaStackhelloworldlambdaasgPCU388B92B5",
            "StartTime": "2022-07-02T11:57:31.400000+02:00",
            "EndTime": "2022-07-02T11:59:13.059000+02:00",
            "StatusCode": "Successful",
            "StatusMessage": "Successfully set desired concurrency to 5. Change successfully fulfilled by lambda."
        },
       ....
    ]
}
If everything is working as expected you should see the current value change based on the increase or decrease of utilization.
{
        "Description": "Setting desired concurrency to 5.",
        "StatusCode": "Successful",
}
Some gotchas while testing
We've tested our function and have seen that the provisioned concurrency configuration for our lambda is scaling properly, so now is a good time to talk about some gotchas. While testing this it's important to keep in mind that if you run a very big load test against your lambda and your test is finished, you need to make sure that you either manually scale down in your dev/test environment or send some slow traffic to your services over a period of time. While testing this myself I noticed in our dev/test environment that after we did our tests, the provisioned concurrency number was not going down. As we've seen in a previous section of the article, scaling up and down is based on a CloudWatch Alarm. The alarms, however, are by default configured with "Treat missing data as missing", which means that if there is no traffic no alarms will be triggered and you can have quite some warm functions in your account which quickly starts to add up in unnecessary costs.
Summary
In this post we looked at scaling the provisioned concurrency settings for lambda functions by means of configuring them via AWS CDK. As you've seen it's relatively simple to configure and it can help you save cost and keep latency down.