
Photo by Markus Winkler on Unsplash
Lessons learned from picking a Java based driver for Amazon ElastiCache for Redis - Part 1
Exploring failover scenarios with Jedis
In my day-to-day job, I support teams at different organizations and help them with their AWS challenges. One of the teams I recently supported, was using Amazon ElasticCache for Redis as a storage/caching layer for their primary workload. They were validating their production setup and testing several failure scenarios. In this post, I will share some of the lessons learned. Keep in mind that the cases described in this post are very context-specific and might not reflect your use case, so my advice is to always do your own tests.
The initial architecture
The team had built a REST-based service by using API Gateway, AWS Lambda and Amazon ElastiCache for Redis.
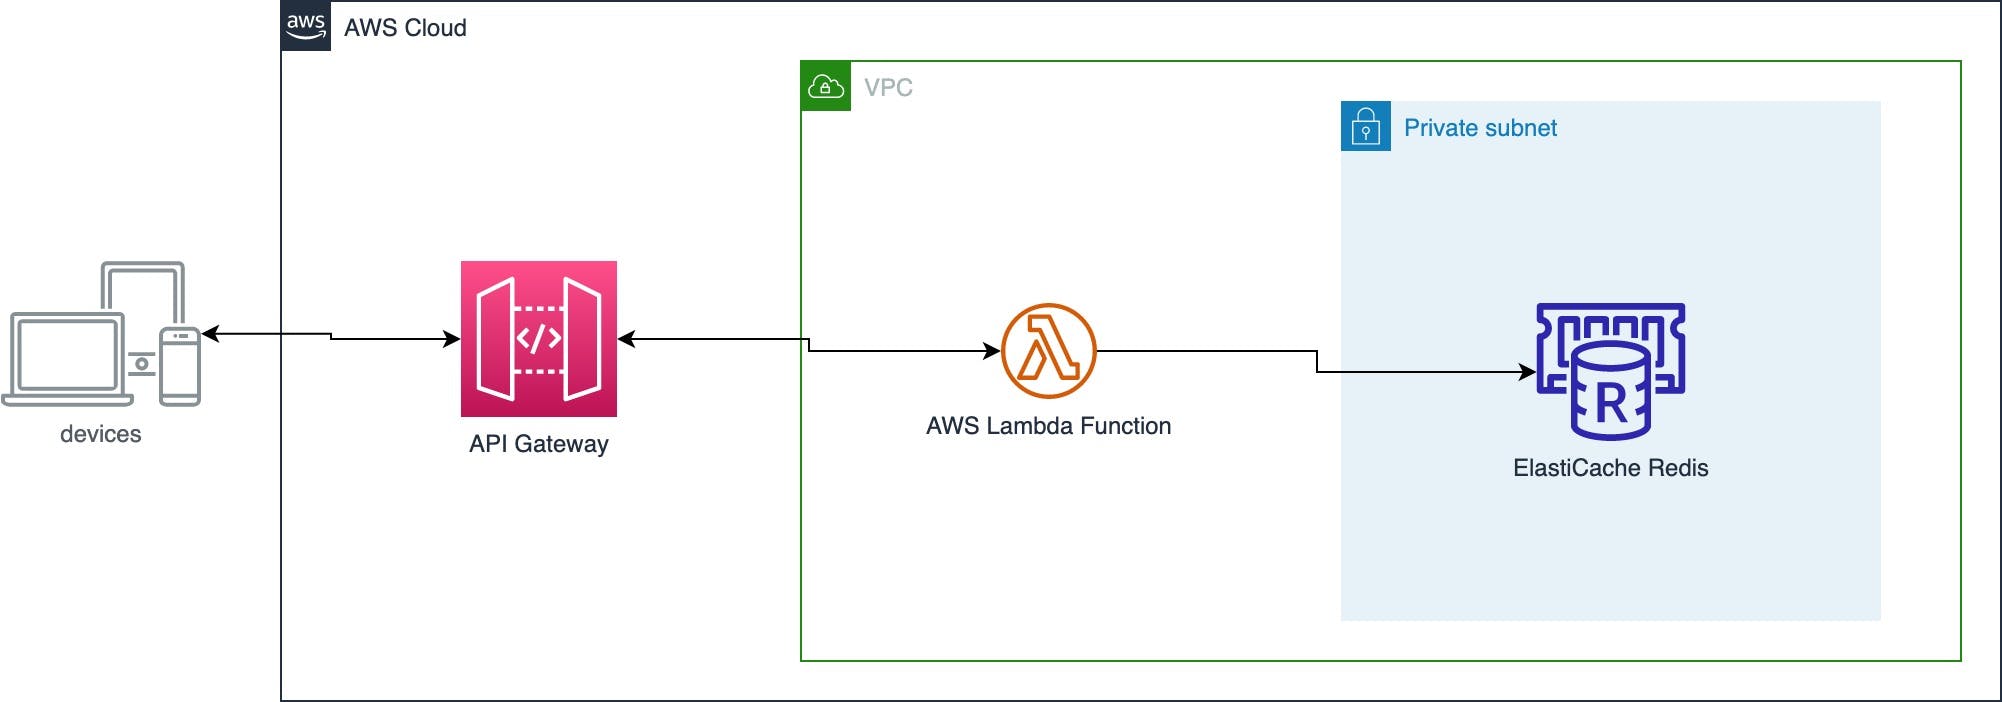
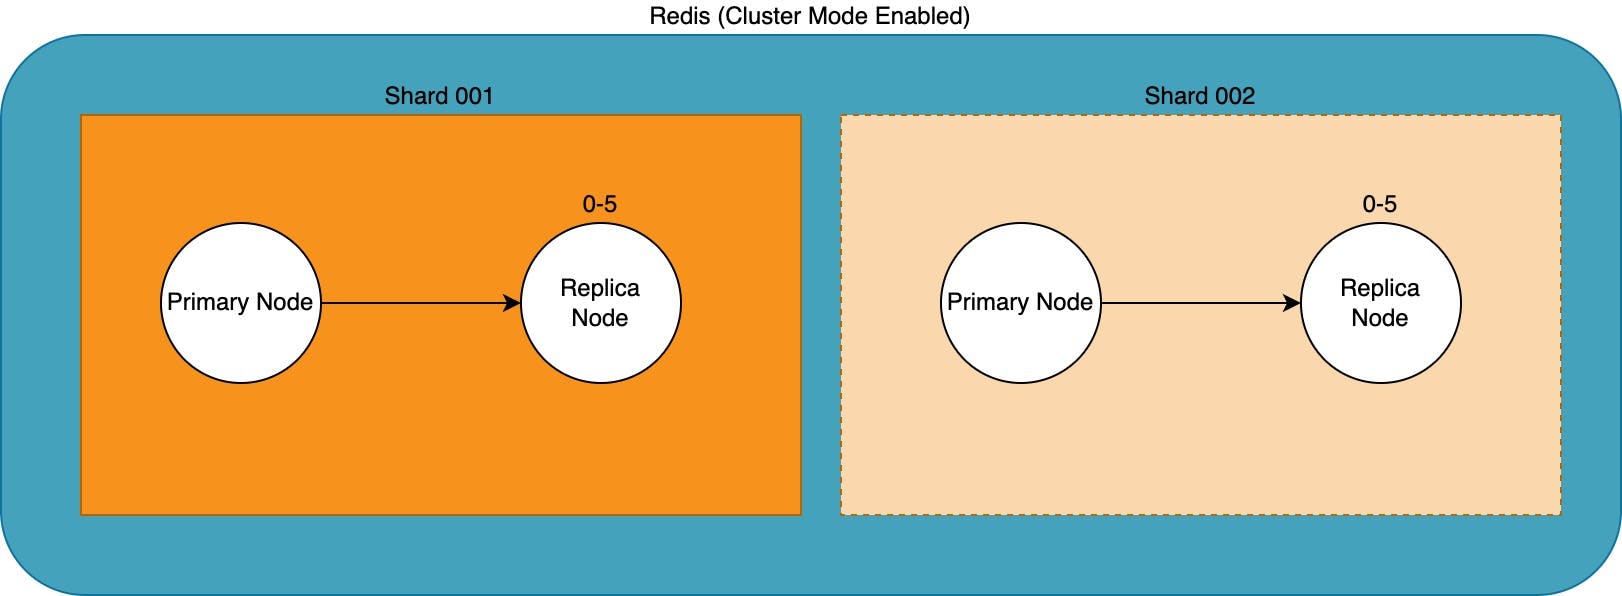
Amazon ElastiCache for Redis was set up with cluster mode enabled as this gave the team the flexibility to scale both read and write actions. The initial cluster existed of just a single shard, with the option to scale up/out if needed.
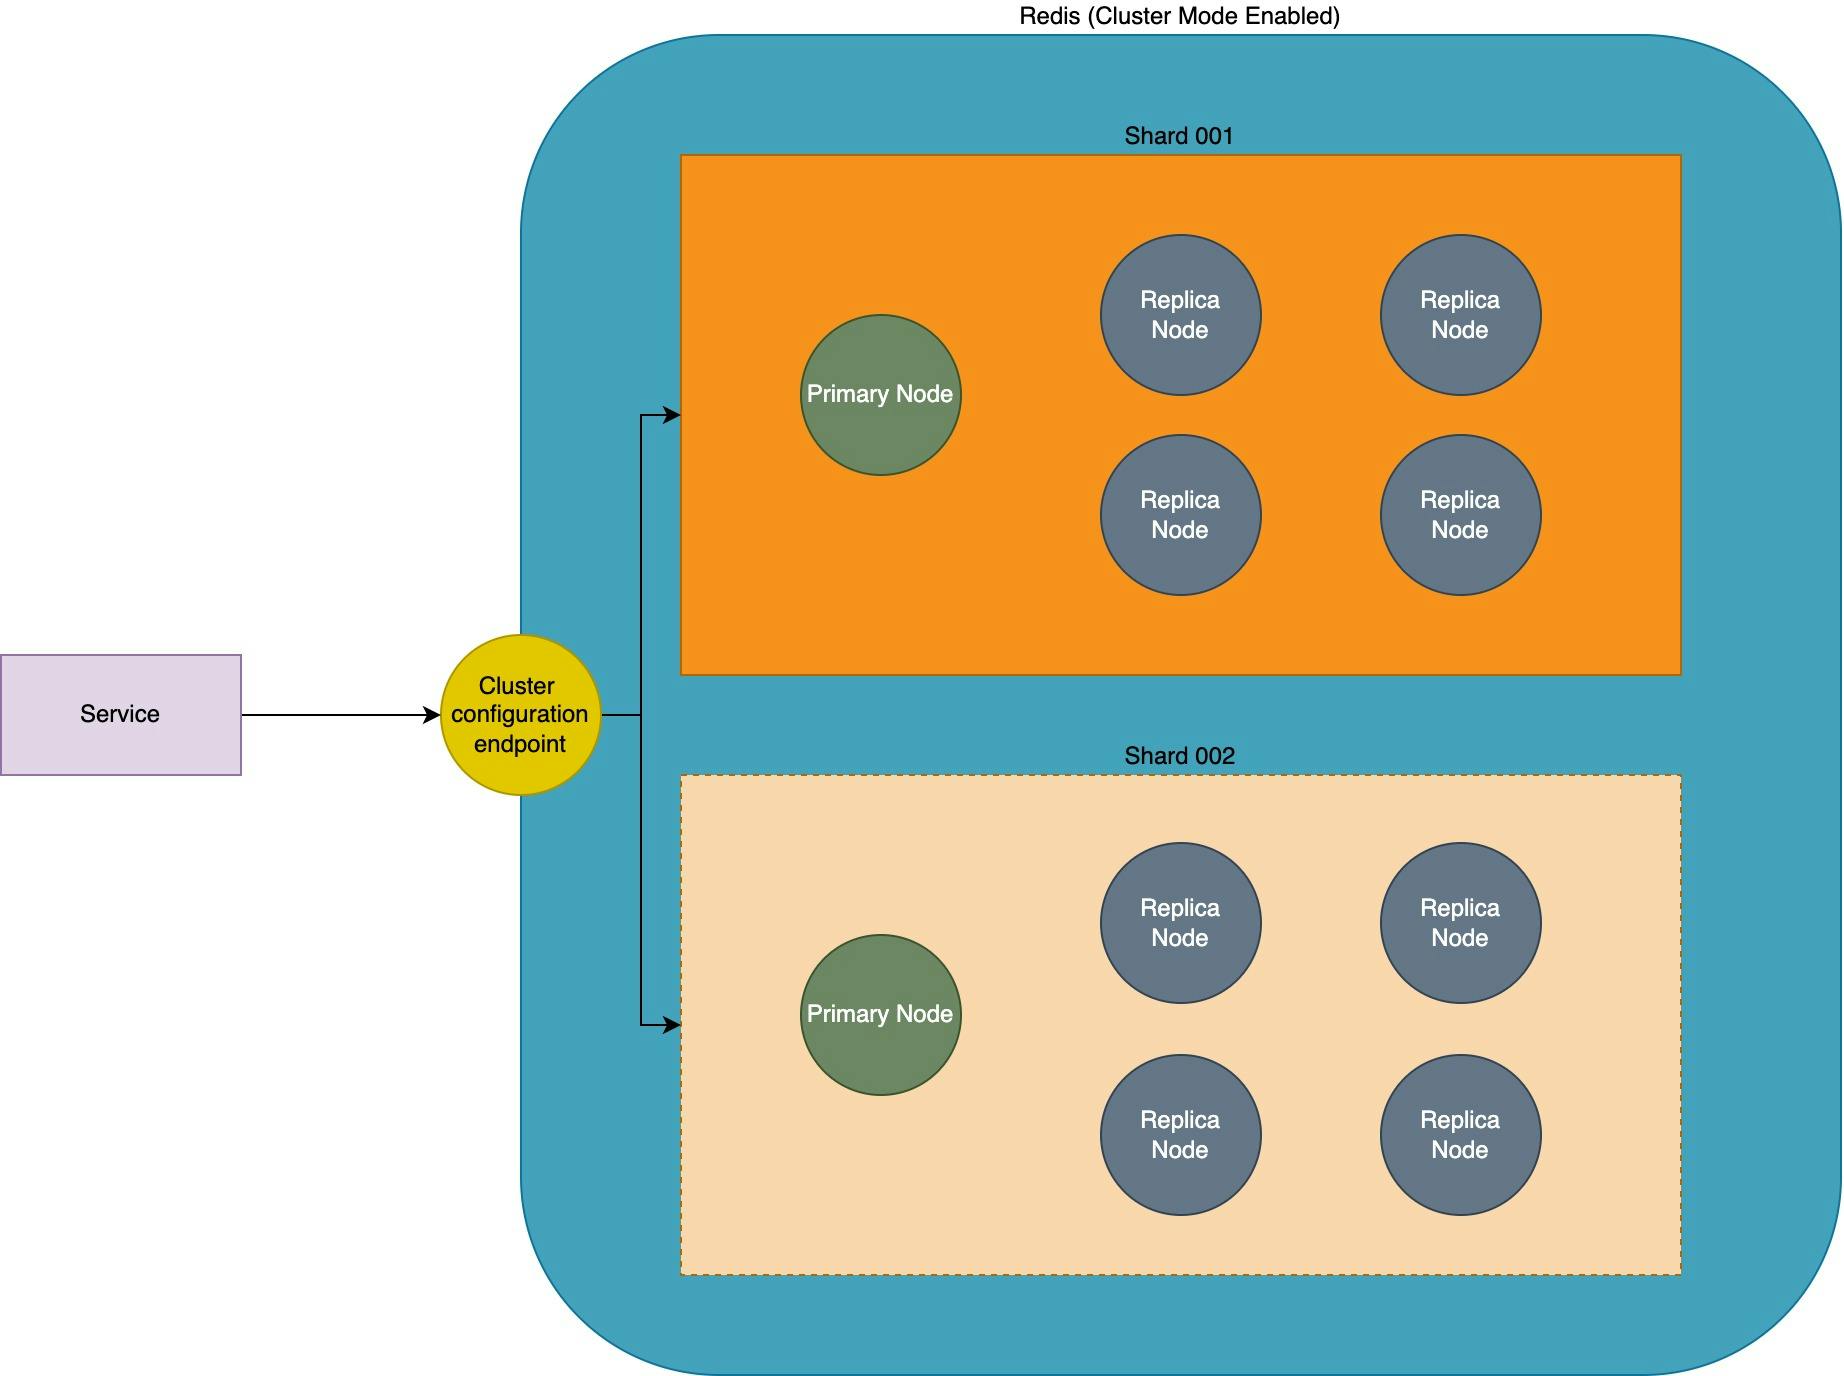
When the Redis client writes to and reads from the cluster it will first check which shard the data belongs to and sends the read or write command to the node in that particular shard.
Now when you set up ElastiCache Redis with Cluster Mode enabled in AWS, the recommended way to connect with the cluster from your client is by connecting via the cluster configuration endpoint. The cluster configuration endpoint keeps track of all the changes in the Redis cluster and can give you an up-to-date topology.
The AWS Lambda function had been written in Java and therefore the team looked at different Java-based Redis drivers and eventually decided to use Jedis, a Java client for Redis designed for performance and ease of use. One of the reasons they chose to use Jedis was that it proved to be a lightweight library. Instantiating the client connection takes somewhere between 200-600ms (depending on the lambda memory settings) which impacts the cold start of the lambda function.
private JedisRedisService() {
  logger.info("Instantiating Redis Cluster connection");
  HostAndPort hostAndPort = new HostAndPort(REDIS_HOST, Integer.valueOf(REDIS_PORT));
  ConnectionPoolConfig connectionPoolConfig = new ConnectionPoolConfig();
  connectionPoolConfig.setMaxTotal(5);
  connectionPoolConfig.setMaxIdle(5);

  DefaultJedisClientConfig defaultJedisClientConfig =     DefaultJedisClientConfig.builder()
    .connectionTimeoutMillis(JedisCluster.DEFAULT_TIMEOUT)
    .socketTimeoutMillis(JedisCluster.DEFAULT_TIMEOUT)
    .blockingSocketTimeoutMillis(JedisCluster.DEFAULT_TIMEOUT)
    .user(REDIS_USERNAME)
    .password(REDIS_PASSWORD)
    .ssl(true)
    .build();

  jedisCluster = new JedisCluster(
    hostAndPort,
    defaultJedisClientConfig,
    JedisCluster.DEFAULT_MAX_ATTEMPTS,
    connectionPoolConfig
  );
  logger.info("Instantiated Redis Cluster connection");
}
Jedis has shown to be the fastest driver for specific scenarios based on the "Optimize Redis Client Performance for Amazon ElastiCache and MemoryDB" post on the AWS blog. Performance for a cache is very important, but we also wanted to look at different aspects of the driver.
Expect the unexpected
Werner Vogels often states that you should always expect the unexpected if you're building in the Cloud. Things can break and it's best to prepare for that as much as possible.
Failures are a given and everything will eventually fail over time: from routers to hard disks, from operating systems to memory units corrupting TCP packets, from transient errors to permanent failures. This is a given, whether you are using the highest quality hardware or lowest cost components. -- Source: 10 Lessons from 10 Years of Amazon Web Services
To test how Jedis would handle some 'failure' scenarios and we decided that we wanted to test for at least the things we could expect.
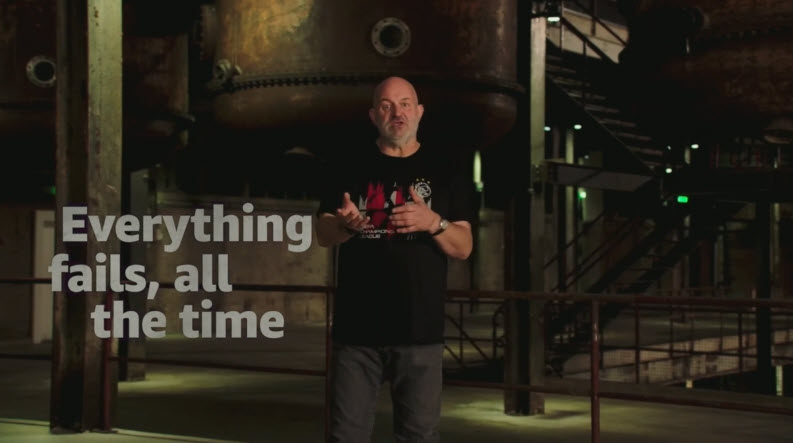
Source: https://aws.amazon.com/blogs/aws/reinvent-2020-liveblog-werner-vogels-keynote/
Two scenarios we could think of were:
A primary node failure
A maintenance upgrade that would rotate and update the nodes to a new version of Redis
We performed these tests with Jedis version 4.2.3 and later we retried with 4.3.1 as there were a couple of fixes and improvements regarding Redis clusters.
To test the impact we created a simple Lambda function that performs GET operations on a specific set of keys within our cache. As we wanted to test under 'real-world' circumstances we created a small load test with Artillery.io that was sending a constant stream of requests.
As a response, we represent the value of the get method and list the available nodes in the cluster.
{
  "nodes": [
    "test-cluster-0001-001.test-cluster.ifrpha.euw1.cache.amazonaws.com:6379",
    "test-cluster-0001-002.test-cluster.ifrpha.euw1.cache.amazonaws.com:6379",
    "test-cluster-0001-003.test-cluster.ifrpha.euw1.cache.amazonaws.com:6379"
  ],
  "test": "test value"
}
Primary node failover
As ElastiCache for Redis was the primary data source for the service, the team wanted to see the impact of a primary node failure. The service was predicated to have a read-heavy workload and our small test cluster consisted of 1 primary node and 2 replica nodes. The team was expecting to have a similar production setup when the service would launch. Testing a primary node failure is quite simple in ElastiCache for Redis. From the AWS console, you can trigger the fail-over utilizing a button.
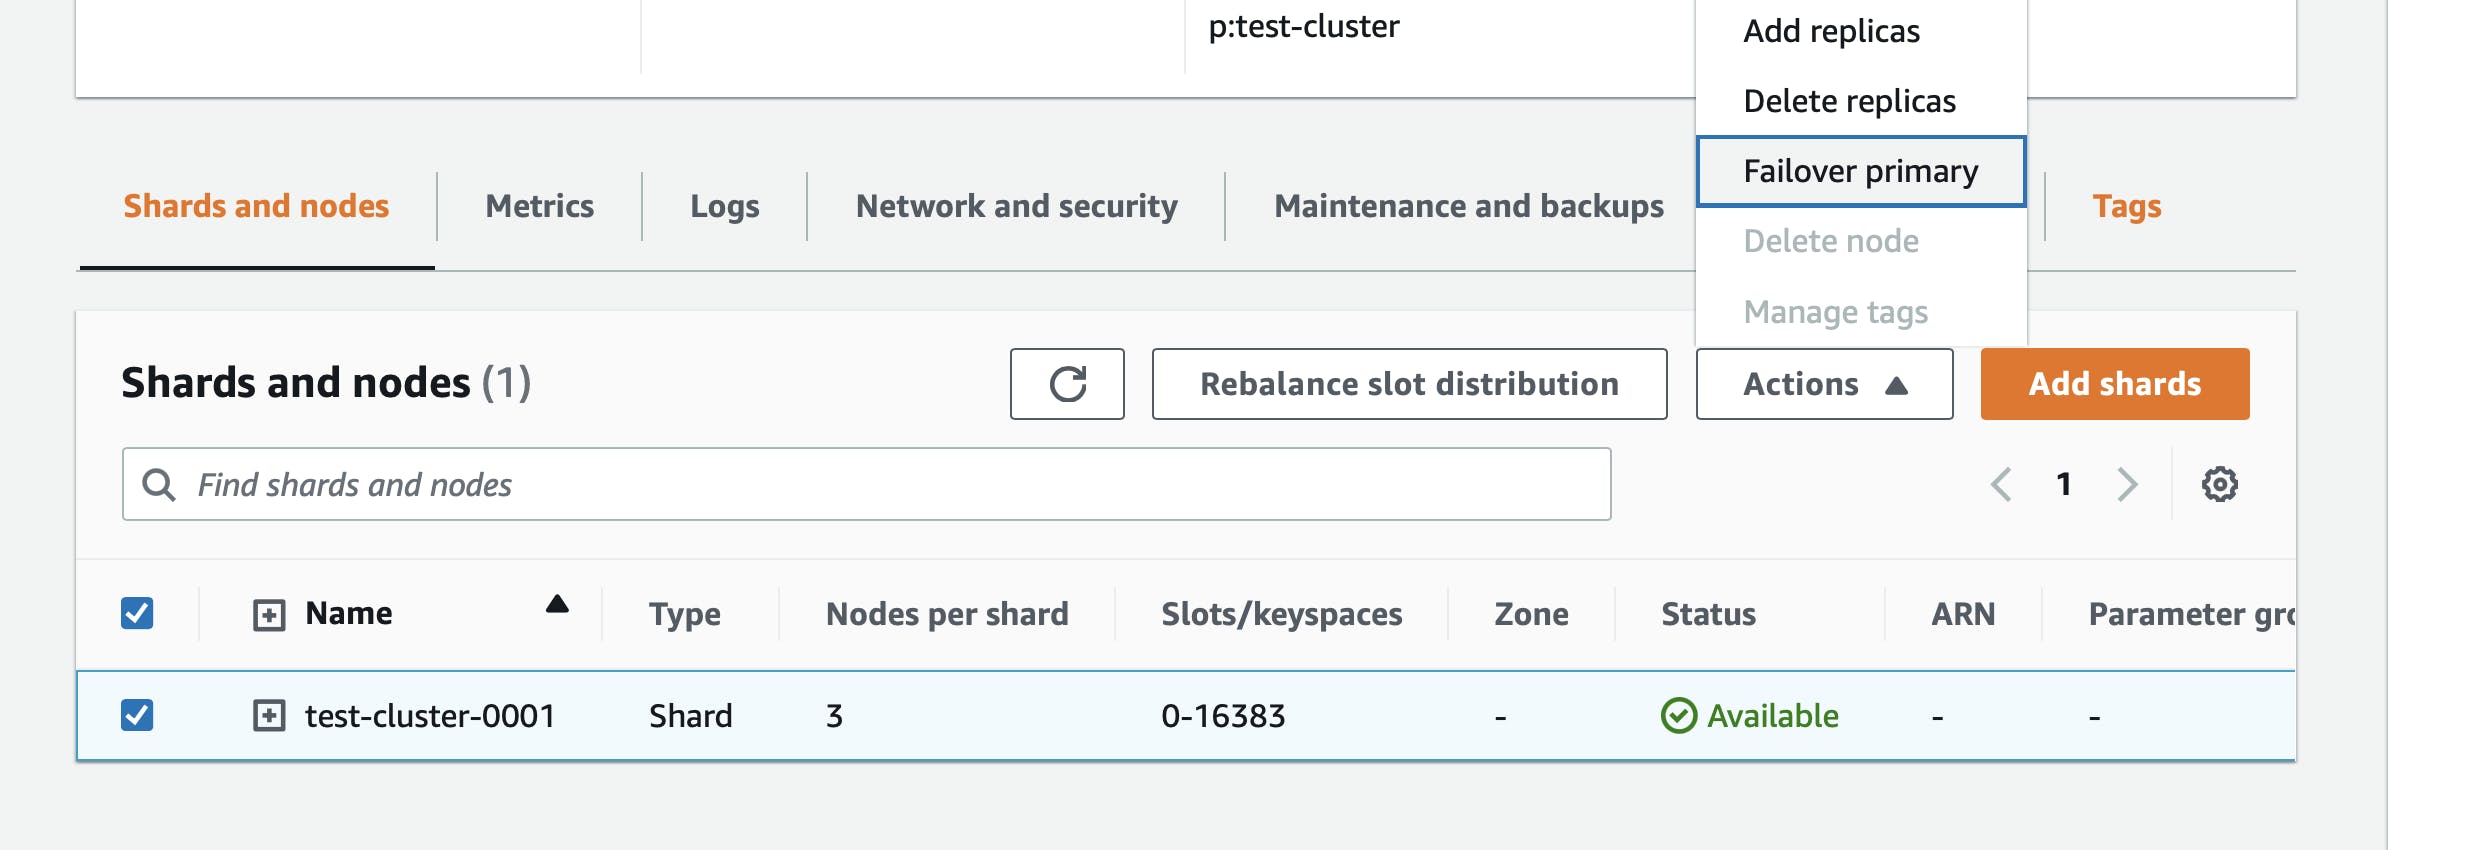
Or from the command line by executing:
aws elasticache test-failover /
    --replication-group-id "test-cluster" /
    --node-group-id "0001"
Once the failover was triggered we could track its progress in the ElastiCache events logs. The event log can be found in the AWS Console or from the AWS CLI by executing:
aws elasticache describe-events --max-items 5
This will result in a JSON or table-based response that contains a list of events in the order they took place.
| Source ID | Type | Date | Event |
| test-cluster-0001-001 | cache-cluster | November 12, 2022, 14:43:40 (UTC+01:00) | Finished recovery for cache nodes 0001 |
| test-cluster-0001-001 | cache-cluster | November 12, 2022, 14:33:22 (UTC+01:00) | Recovering cache nodes 0001 |
| test-cluster | replication-group | November 12, 2022, 14:31:59 (UTC+01:00) | Failover to replica node test-cluster-0001-002 completed |
| test-cluster | replication-group | November 12, 2022, 14:30:56 (UTC+01:00) | Test Failover API called for node group 0001 |
As you can see from the above event log, the cluster first performs a failover after which it recovers the node and adds it back into the cluster. If you look closely you can see that the time between triggering the failover action and the actual failover takes about a minute. We ran this test multiple times and we've seen this vary from close to a minute to up to two minutes.
We noticed that from the moment the primary node was taken down our service started throwing errors. From the CloudWatch logs, we noticed several jedis related errors:
Cluster retry deadline exceeded.: redis.clients.jedis.exceptions.JedisClusterOperationException
redis.clients.jedis.exceptions.JedisClusterOperationException: Cluster retry deadline exceeded.
    at redis.clients.jedis.executors.ClusterCommandExecutor.executeCommand(ClusterCommandExecutor.java:88)
    at redis.clients.jedis.UnifiedJedis.executeCommand(UnifiedJedis.java:148)
    at redis.clients.jedis.UnifiedJedis.get(UnifiedJedis.java:570)
and
2022-10-16 19:03:28 7e6d77f1-eea2-4c9e-ab3c-da108d1c9b16 DEBUG ClusterCommandExecutor - Failed connecting to Redis: null
redis.clients.jedis.exceptions.JedisConnectionException: Failed to connect to any host resolved for DNS name.
    at redis.clients.jedis.DefaultJedisSocketFactory.connectToFirstSuccessfulHost(DefaultJedisSocketFactory.java:63) ~[task/:?]
    at redis.clients.jedis.DefaultJedisSocketFactory.createSocket(DefaultJedisSocketFactory.java:87) ~[task/:?]
    at redis.clients.jedis.Connection.connect(Connection.java:180) ~[task/:?]
    at redis.clients.jedis.Connection.initializeFromClientConfig(Connection.java:338) ~[task/:?]
    at redis.clients.jedis.Connection.<init>(Connection.java:53) ~[task/:?]
    at redis.clients.jedis.ConnectionFactory.makeObject(ConnectionFactory.java:71) ~[task/:?]
The total duration of exceptions in our log ended up taking about 6 minutes. As the load was the same during the failover we did not notice any lambda cold starts during the failover.
During that time our service was mostly responding with errors and not servicing our clients.
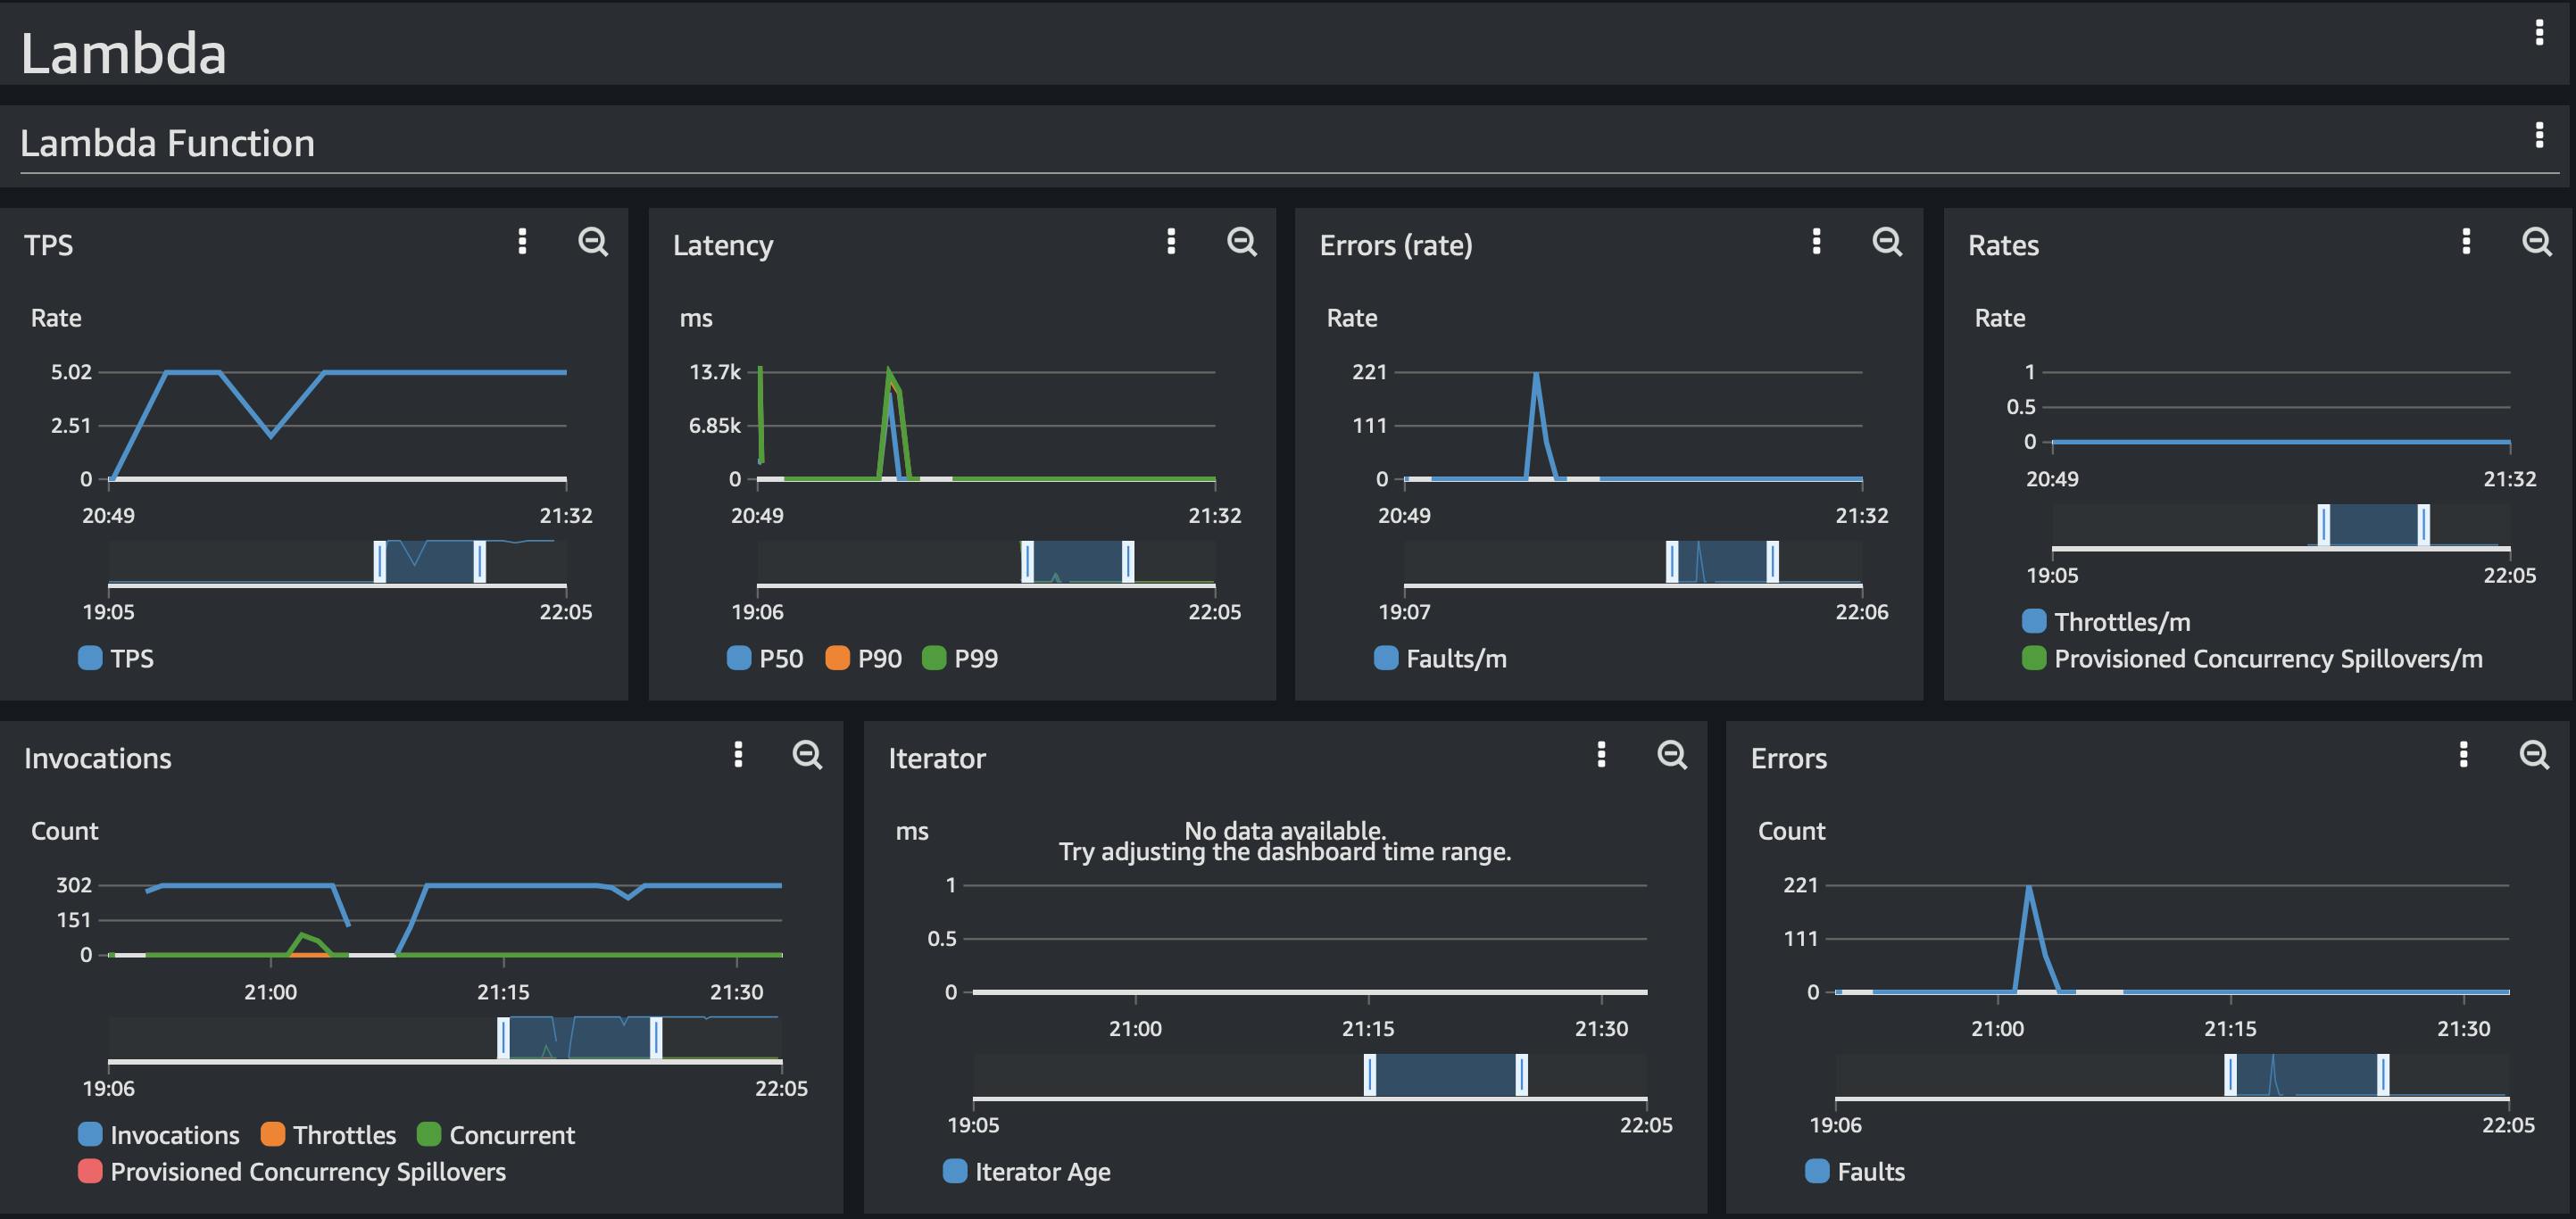
Finding out what's causing that was not that simple as Jedis does not write a lot of log information when the log level is set to debug. From what we could tell from the Jedis source code it seems that when the Jedis client connects to the configuration endpoint it fetches all known hosts. It stores that in a local cache and figures out the primary node from the set of nodes. Once the primary node is known it will execute operations against the primary node. It does so by connecting to the Amazon-generated domain name/entry and when that entry is down / unreachable it seems it does not use the configuration endpoint to rediscover the nodes or fetch the new cluster topology. We initially thought this had to do with the DNS caching of the JVM, so we also tried to disable caching, but we did not see any effect after that change.
{
 java.security.Security.setProperty("networkaddress.cache.ttl","0");
 java.security.Security.setProperty("networkaddress.cache.negative.ttl", "0");
}
From the Jedis source code, we learned that a bit of randomization is applied once the node is marked as unavailable. This seems to happen only when the connection attempt has timed out after several retry attempts. It will randomly connect to one of the remaining nodes and by chance, it might find the new primary node and it will forget about the old primary. We found this out by looking at the code and printing the list of nodes available to the client. We noticed that even when the old primary is added back to the cluster as a replica, that node will not be known by our application. Because we were using AWS Lambda and Lambdas are rotated at a random moment in time a cold start would probably solve this issue but in the meantime, one of the nodes will be missing from the total set of nodes for that duration which could impact the availability of our service.
As we were experiencing issues while rotating nodes we were wondering about the impact of a version upgrade. A version upgrade would probably also take down nodes, so that’s what we tested next.
Cluster engine version upgrade
The next scenario was running a cluster engine upgrade. To validate the impact of a version upgrade we migrated from version Redis 6.0.x to 6.2.x. Again the event log can show us the timing of the procedure:
| Date | Message | SourceIdentifier | SourceType |
| 2023-01-30T12:48:35.546000+00:00 | Cache cluster patched | test-cluster-0001-001 | cache-cluster |
| 2023-01-30T12:47:42.064000+00:00 | Cache node 0001 restarted | test-cluster-0001-001 | cache-cluster |
| 2023-01-30T12:47:40.055000+00:00 | Cache node 0001 shutdown | test-cluster-0001-001 | cache-cluster |
| 2023-01-30T12:46:28.167000+00:00 | Failover from master node test-cluster-0001-001 to replica node test-cluster-0001-002 completed | test-cluster-0001-001 | cache-cluster |
| 2023-01-30T12:46:28.167000+00:00 | Failover from master node test-cluster-0001-001 to replica node test-cluster-0001-002 completed | test-cluster | replication-group |
| 2023-01-30T12:46:26.946000+00:00 | Failover to replica node test-cluster-0001-002 completed | test-cluster | replication-group |
| 2023-01-30T12:45:40.725000+00:00 | Cache cluster patched | test-cluster-0001-003 | cache-cluster |
| 2023-01-30T12:44:47.350000+00:00 | Cache node 0001 restarted | test-cluster-0001-003 | cache-cluster |
| 2023-01-30T12:44:45.348000+00:00 | Cache node 0001 shutdown | test-cluster-0001-003 | cache-cluster |
| 2023-01-30T12:43:32.918000+00:00 | Cache cluster patched | test-cluster-0001-002 | cache-cluster |
| 2023-01-30T12:42:39.710000+00:00 | Cache node 0001 restarted | test-cluster-0001-002 | cache-cluster |
| 2023-01-30T12:42:37.707000+00:00 | Cache node 0001 shutdown | test-cluster-0001-002 | cache-cluster |
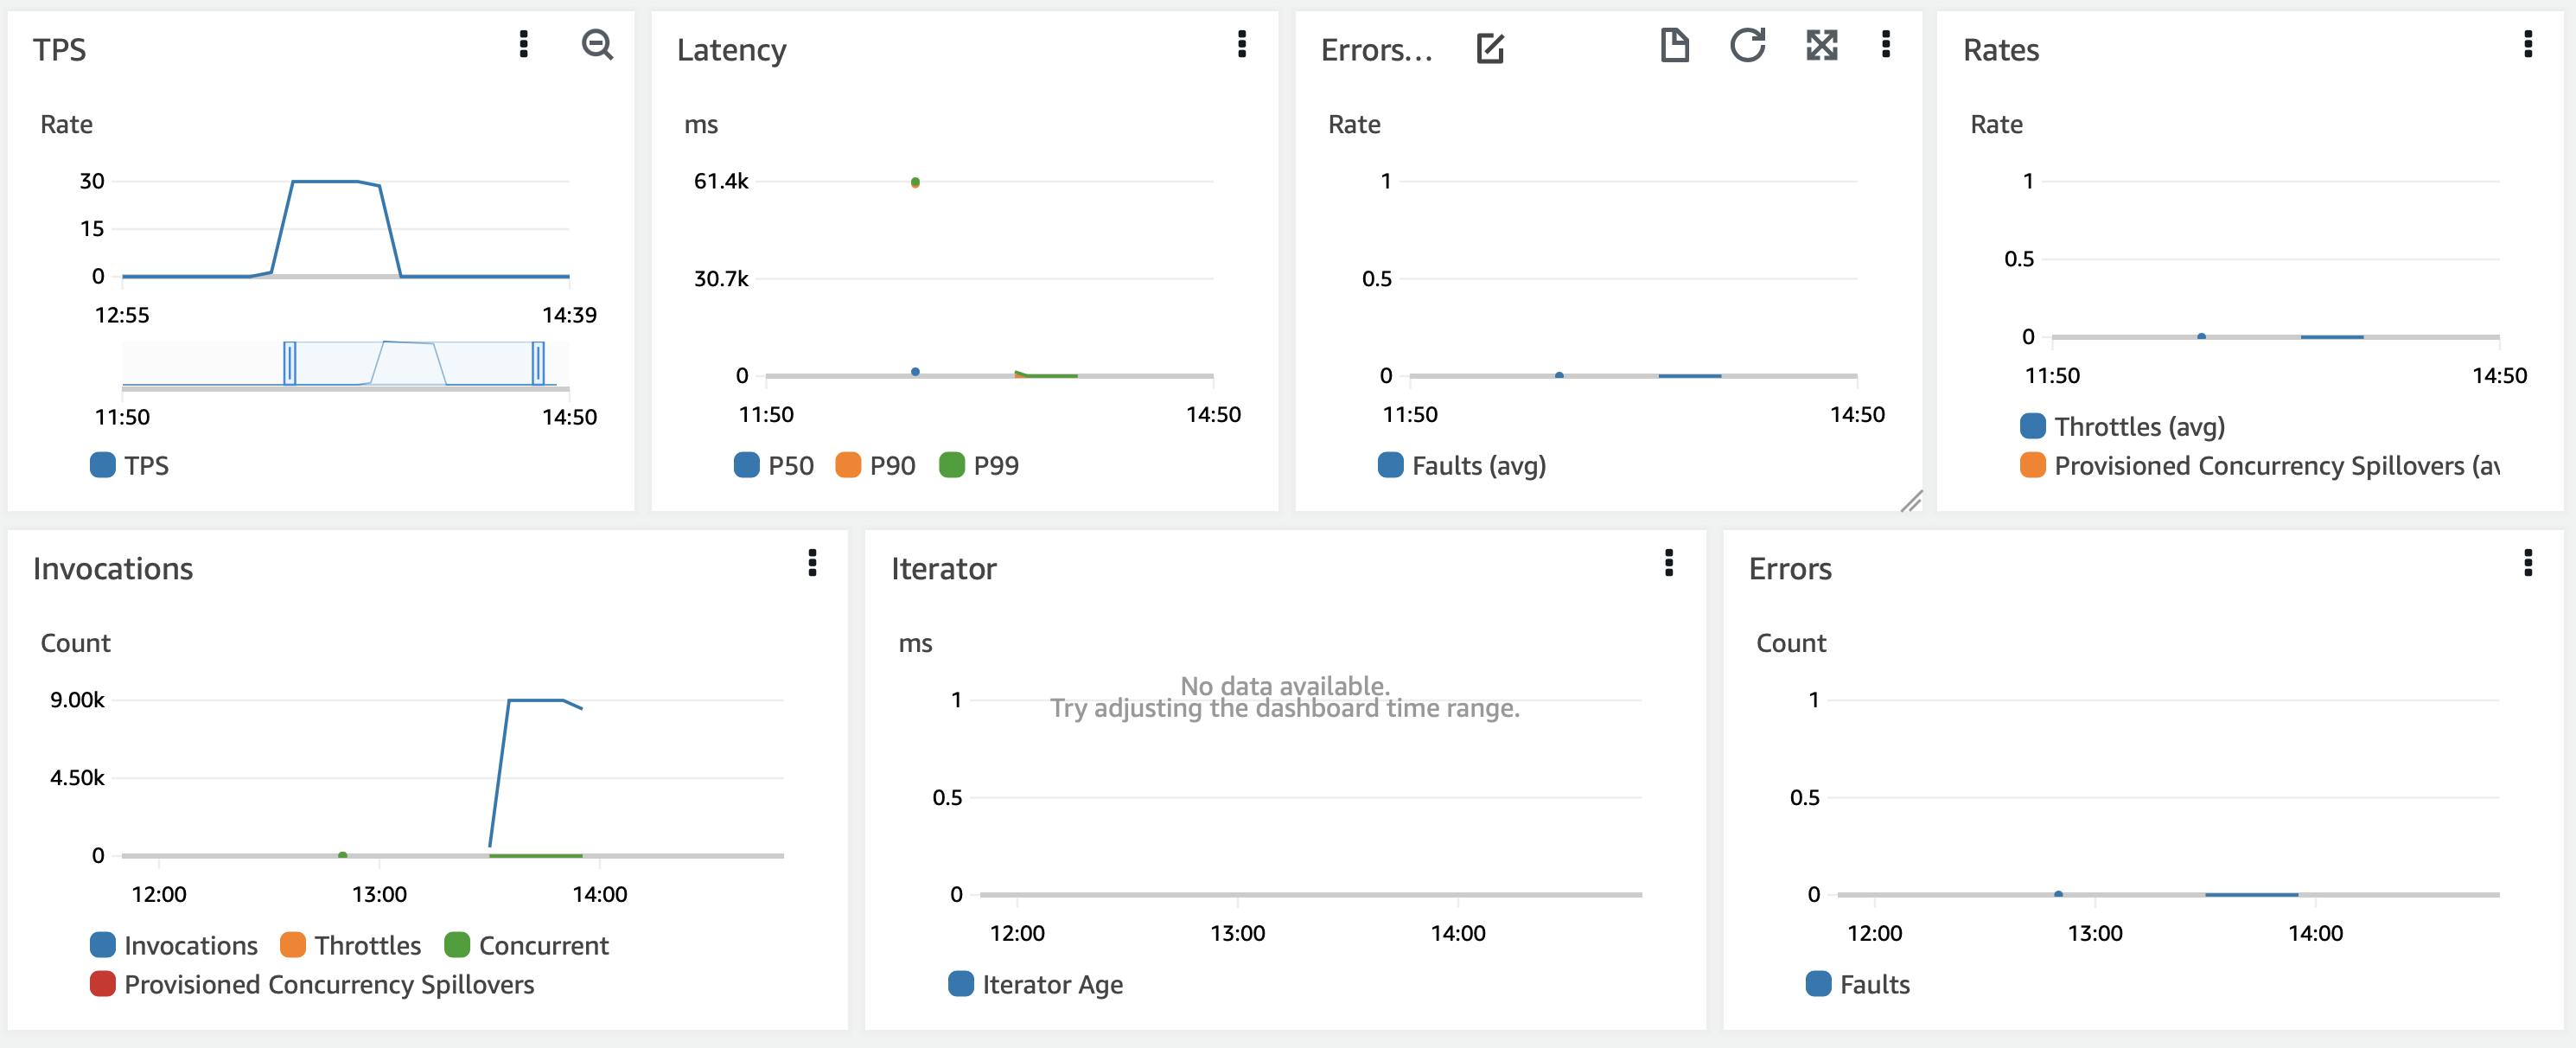
To our surprise, this did not result in the same behaviour. We noticed that nodes kept upgrading but our service was not generating any errors during that time.
Conclusion
Testing the above scenarios helped us get a better understanding of how our driver would handle specific cluster-wide events. Having a few minutes of downtime/errors during a primary failover event is not ideal and it depends on your use case if that's acceptable for your workload. While researching mitigation scenarios we learned that the Tinder engineering team discovered similar behaviour with Jedis in production, which they described in their post "Taming ElastiCache with Auto-discovery at Scale". This triggered us to also do some testing with a different Java-based Redis driver. You can find more about that in part 2.
